
What Is The Difference Between Visible And Infrared Satellite Imagery?
Visible satellite imagery is a picture of sunlight reflected off clouds and the ground, so it is sharp but goes dark at night. Infrared imagery measures heat given off by cloud tops and the surface, so it works around the clock. On infrared, colder cloud tops are higher, which usually means taller, stronger storms.
Radar tells you what is falling. Satellites tell you what is building, including over the ocean where no radar reaches. On the Space Coast I watch the afternoon towers pop on visible imagery long before the first echo shows up. Here is how to read the two views without fooling yourself.
Key Takeaways
- Visible imagery shows reflected sunlight, has the best resolution, and goes dark at night.
- Infrared imagery shows emitted heat and works day and night.
- On infrared, colder cloud tops are higher tops, and higher tops usually mean stronger storms.
- Low fog and stratus can hide in nighttime infrared because they are nearly as warm as the ground.
- Overshooting tops and the enhanced-V are satellite clues to very strong updrafts, but they are not warnings.
Radar shows what is falling inside a storm, but only within about 230 km (143 miles) of each site. Weather satellites fill in everything else: oceans, mountains, whole continents, and the tops of clouds that radar cannot see. The two workhorse views are visible and infrared, and they measure completely different things. Knowing which is which is the key to reading them correctly.
What Does Visible Satellite Imagery Show?
Visible Imagery is essentially a black-and-white photograph taken from space. The satellite's sensor measures sunlight reflected back upward at wavelengths near 0.64 micrometers (red light). Bright surfaces reflect more; dark surfaces absorb more. The fraction reflected is called Albedo.
- Thick clouds (a mature thunderstorm, a deep stratus deck) have high albedo and look bright white.
- Thin cirrus lets much of the light through and looks faint and gray.
- Oceans and forests absorb most sunlight and look dark.
- Fresh snow is bright too, which can fool the eye; snow stays put while clouds move in an animation.
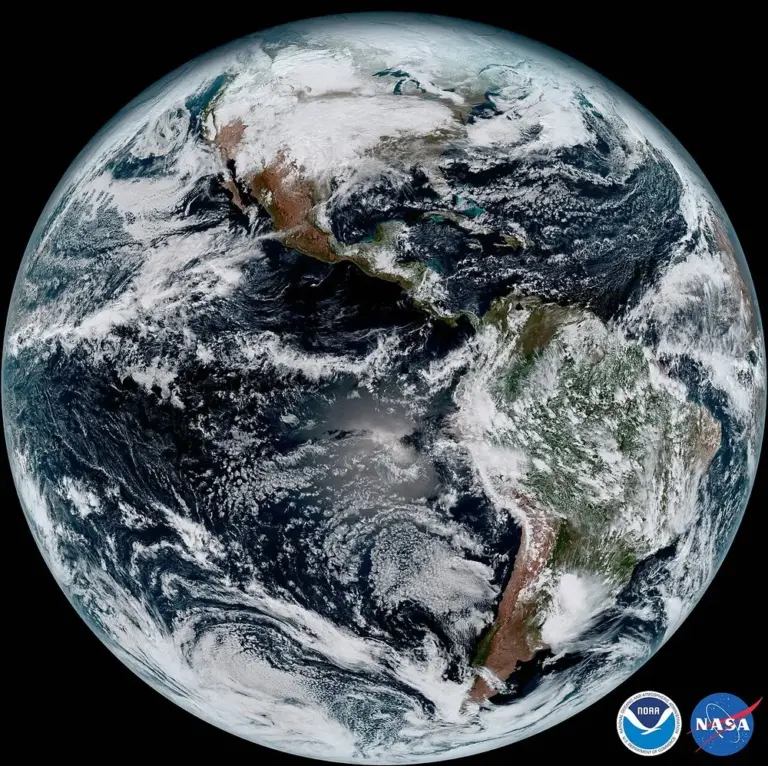
Visible imagery has the best resolution of any channel, down to 0.5 km on the current GOES satellites. That makes it superb for spotting small features: new cumulus towers bubbling up along a boundary, the texture of storm tops, fog filling valleys at sunrise, and outflow boundaries marked by lines of low cloud.
Its big weakness is obvious: no sun, no picture. At night the visible channel goes dark.
What Does Infrared Satellite Imagery Show?
Every object emits infrared radiation according to its temperature. Infrared Imagery measures this emission, most commonly in the "clean" longwave window near 10.3 micrometers, where the atmosphere is nearly transparent. Because it measures emitted energy rather than reflected sunlight, infrared works day and night.
The satellite converts the measured energy into a Brightness Temperature: the temperature a perfect emitter would need to produce that signal. For thick clouds, the brightness temperature is very close to the actual temperature of the cloud top.
That leads to the central rule of infrared interpretation:
- Temperature falls with height through the Troposphere, at roughly 6.5 degrees C per kilometer on average.
- So colder cloud tops are higher cloud tops.
- Higher tops usually mean deeper clouds and stronger storms.
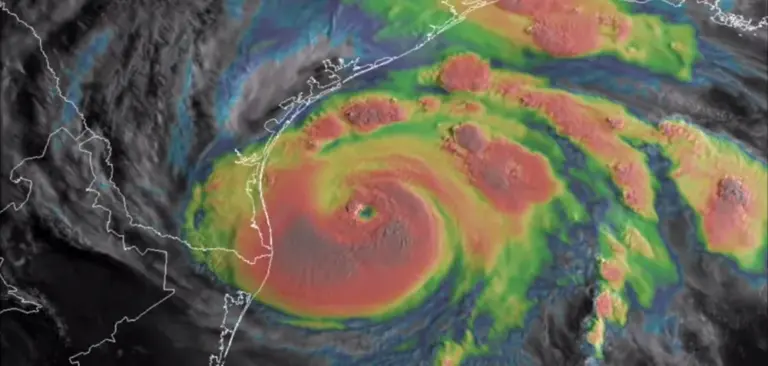
Raw infrared images show cold as white and warm as dark, so high clouds look bright. Forecasters apply color enhancements so that the coldest tops pop out: a typical scheme turns tops colder than about -40 degrees C into blues, greens and reds, with the very coldest (below -70 degrees C) shown in black, purple or white.
Pitfalls Of Each Channel
- Low clouds and fog in infrared: stratus is nearly the same temperature as the ground, so it can be almost invisible in IR, especially at night. Forecasters use a "fog product" that subtracts a shortwave channel (3.9 micrometers) from the longwave to detect it.
- Thin cirrus in infrared: thin ice clouds let warmer radiation from below leak through, so they look warmer and lower than they really are.
- Cold ground: in winter, a frozen surface can be as cold as low clouds, blurring the contrast.
- Visible at dawn and dusk: shading changes rapidly as the sun angle changes.
Combining the two solves many of these: a feature that is bright in visible but warm in infrared is a low cloud; a feature that is faint in visible but cold in infrared is thin cirrus; bright and cold together is a deep convective cloud.
How Do You Spot A Severe Storm On Satellite?
Cold Cloud Tops
A thunderstorm's updraft carries air up until it reaches the Tropopause, where the stable stratosphere stops it and the cloud spreads out into an anvil. Tops of -60 to -75 degrees C are common in strong storms over the central United States.
Overshooting Tops
An exceptionally strong updraft has so much momentum that it punches above the anvil into the lower stratosphere, forming an Overshooting Top. In visible imagery it looks like a bubbling dome casting a shadow on the anvil. In infrared it shows as a small spot noticeably colder than the surrounding anvil, often by 5 to 15 degrees C, because the rising air keeps cooling as it overshoots. Overshooting tops that persist or pulse repeatedly are strongly linked to large hail, damaging winds and tornadoes.
The Enhanced-V
Upper-level winds flowing around the overshooting top split and carry cold cloud material downstream in two arms, forming a V or U shape pointing upwind in infrared imagery. This Enhanced-V often has a "warm wake" inside the V, where warmer stratospheric air or ice plumes sit above the anvil. It signals a very strong, long-lived updraft in a strongly sheared environment, the classic setup for a Supercell.
Real-World Example: A Florida Summer Afternoon From Above
On a typical summer day in Florida, the visible loop around late morning shows rows of small cumulus lining up along the sea breeze fronts on both coasts. As the afternoon goes on, some of those towers turn lumpy and bright. Switch to infrared and the same towers start showing colder and colder tops as they grow toward the tropopause.
When an anvil spreads out and a small, extra-cold spot keeps pulsing near the updraft, that is an overshooting top. It tells you that updraft means business. Then you check radar and the NWS warnings, because the satellite can only tell you the storm is strong, not what it is doing on the ground.
Common Mistakes
- Myth: Bright white on a satellite image always means a big storm. Fact: On visible imagery, thick low stratus and even fresh snow can be bright white. Check infrared: a deep storm is bright and cold, while low cloud is bright but warm.
- Myth: Satellite images are useless at night. Fact: Only the visible channel goes dark. Infrared and water vapor channels measure emitted energy and work all night.
- Myth: The colors on an infrared image are what the clouds really look like. Fact: The colors are an enhancement added by forecasters to highlight temperature ranges. They mark how cold the cloud tops are, not their actual color.
Go Deeper: Brightness Temperature And Window Channels
An infrared sensor measures radiance in a narrow band, then converts it to a brightness temperature using the Planck function, which describes how much energy a perfect emitter gives off at each wavelength and temperature. The 10.3 micrometer band is called a "clean" window because water vapor and other gases absorb very little there, so most of what the sensor sees comes from the cloud top or surface itself.
Thick cloud tops behave almost like perfect emitters, so their brightness temperature is close to their real temperature. Thin cirrus does not: it is partly transparent, so warmer radiation from below leaks through and the cloud reads too warm. The nighttime fog product works because water droplets emit less efficiently at 3.9 micrometers than at the longwave window, so the difference between the two channels singles out liquid-water low clouds that look nearly invisible in longwave infrared alone.
Check Yourself
No grades, no sign-in. Pick an answer and see how you did. The app keeps score for you and tracks your progress.
1 What does a visible satellite image measure?
Show The Answer
Sunlight reflected by clouds and the surface Visible imagery records reflected sunlight, so it is excellent in daytime but goes dark at night.
2 On an infrared image, why are colder cloud tops generally taller?
Show The Answer
Temperature decreases with height through the troposphere Because the troposphere cools with height, a colder brightness temperature means the cloud top reaches higher.
3 Which feature is often hard to see on a nighttime longwave infrared image?
Show The Answer
Low stratus and fog Low clouds are nearly the same temperature as the ground, so they blend in; a shortwave-minus-longwave fog product helps.
4 What is an overshooting top?
Show The Answer
A dome of cloud punched above the anvil by a very strong updraft Overshooting tops rise into the lower stratosphere and appear as small, very cold spots above the anvil.
5 A feature is bright in visible imagery but warm in infrared. What is it most likely?
Show The Answer
A low cloud deck Bright means thick and reflective; warm means the top is low. Together they point to low cloud such as stratus.
Questions People Ask
Why does the visible satellite image go black at night?
Visible imagery records reflected sunlight. With no sun there is nothing to reflect, so forecasters switch to infrared, which measures heat and works day and night.
What do the colors mean on infrared satellite?
They are an enhancement for cloud-top temperature. Forecasters color tops colder than about -40 degrees C, and the very coldest, below about -70 degrees C, stand out as the highest and usually strongest storm tops.
Why are cold cloud tops a sign of strong storms?
Temperature drops with height through the troposphere, so a colder top is a higher top. Taller clouds usually come from stronger updrafts.
What is an overshooting top?
It is a dome of cloud pushed above the anvil into the lower stratosphere by a very strong updraft. On infrared it shows as a small spot colder than the surrounding anvil, and persistent ones are linked to large hail, damaging winds and tornadoes.
Can a satellite see fog?
Visible imagery shows fog well in daylight. At night fog is hard to see in longwave infrared because it is nearly as warm as the ground, so forecasters use a shortwave-minus-longwave fog product.
Learn More From The Experts
- Three Types Of Satellite Imagery NOAA / NWS Morristown
- Visible And Infrared Imagery NOAA NESDIS
- Geostationary Satellites (GOES-R Series) NOAA NESDIS
Bright and cold, pay attention. Bright and warm, probably just stratus being dramatic. Either way, the warnings come from the NWS. Jen — Jen
